미분은 한 순간의 변화량을 표현한 것이다.
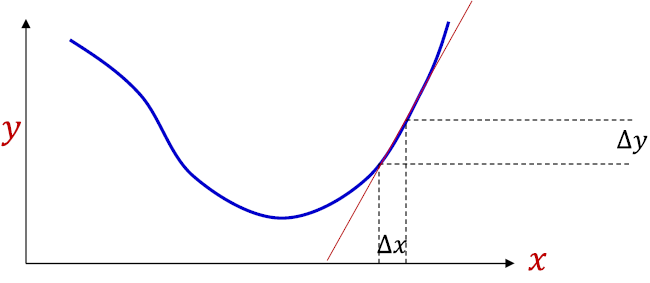
\begin{align} \Delta y = \alpha \Delta x \end{align}
- $\alpha$(기울기)와 x변화량의 곱은 y의 변화량과 같다.
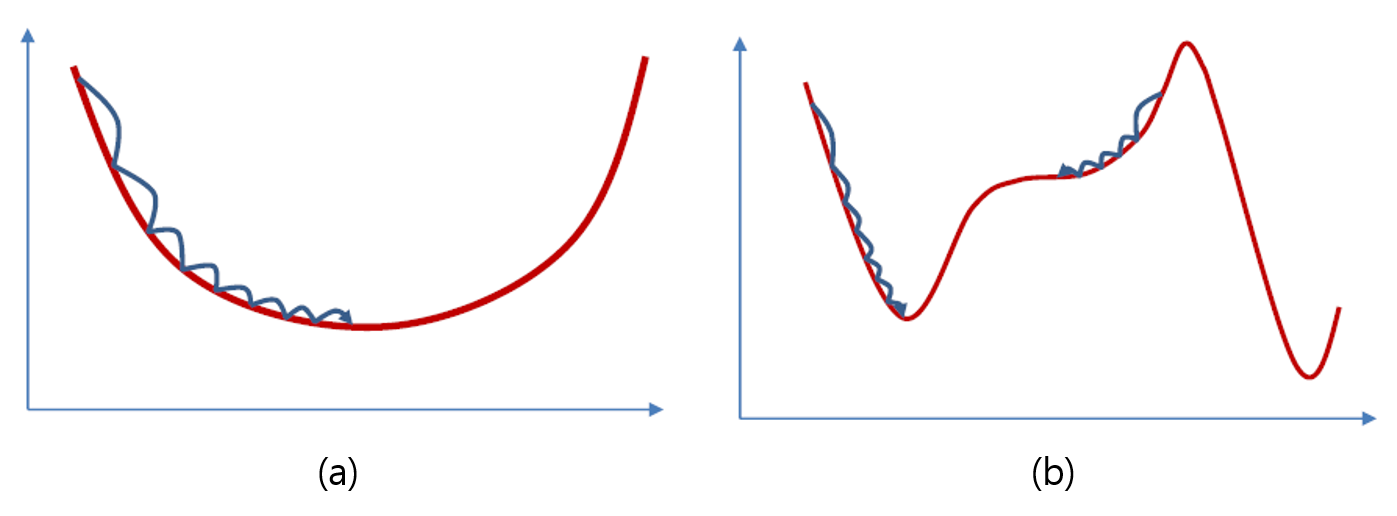
- 일반적인 최적화 문제는 f(x)의 값이 가장 작아지거나 가장 커지는 x를 찾는 것이다.
미분은 한 순간의 변화량을 표현한 것이다.
\begin{align} \Delta y = \alpha \Delta x \end{align}
볼록하지 않은 함수에서는 해당 함수의 극솟값이나 안정점에 도달 할 수 있다. (b)
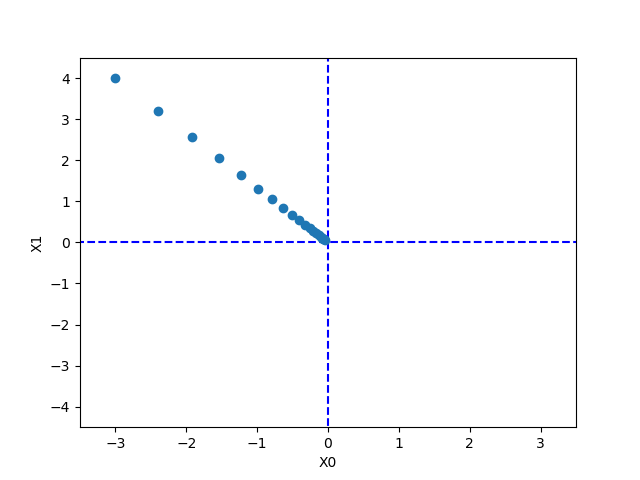
\begin{align} x_0 = \eta ({\partial f / \partial x_0}) \end{align}
1
2
3
4
5
6
7
8
9
10
11
12
13
14
15
16
17
18
19
20
21
22
23
24
25
26
27
28
29
30
31
32
33
34
35
36
37
38
39
40
41
42
43
44
45
46
47
48
49
50
51
52
import numpy as np
import matplotlib.pylab as plt

def numerical_gradient(f, x):
    h = 1e-4
    grad = np.zeros_like(x)

    for idx in range(x.size):
        tmp_val = x[idx]

        # f(x+h)
        x[idx] = tmp_val + h
        fxh1 = f(x)

        # f(x-h)
        x[idx] = tmp_val - h
        fxh2 = f(x)

        grad[idx] = (fxh1 - fxh2) / (2 * h)
        x[idx] = tmp_val
    return grad

def gradient_descent(f, init_x, lr=0.01, step_num=100):
    x = init_x
    x_history = []

    for i in range(step_num):
        x_history.append(x.copy())

        grad = numerical_gradient(f, x)
        x -= lr * grad

    return x, np.array(x_history)

def function_2(x):
    return x[0] ** 2 + x[1] ** 2

init_x = np.array([-3.0, 4.0])

lr = 0.1
step_num = 20
x, x_history = gradient_descent(function_2, init_x, lr=lr, step_num=step_num)

plt.plot([-5, 5], [0, 0], '--b')
plt.plot([0, 0], [-5, 5], '--b')
plt.plot(x_history[:, 0], x_history[:, 1], 'o')

plt.xlim(-3.5, 3.5)
plt.ylim(-4.5, 4.5)
plt.xlabel("X0")
plt.ylabel("X1")
plt.show()
\begin{align} {y_k} = \exp(a_k) / {\sum{^n}}_{i=1} {\exp(a_i)} \end{align}
1
2
3
4
5
6
7
8
# softmax function
def softmax(a):
    c = np.max(a)
    exp_a = np.exp(a - c)
    sum_exp_a = np.sum(exp_a)
    y = exp_a / sum_exp_a

    return y
1
2
3
4
5
6
7
8
np.array([0.3, 2.9, 4.0])
# array([0.3, 2.9, 4. ])

softmax(a)
# array([0.01821127, 0.24519181, 0.73659691])

np.sum(res)
# 1.0